Beftigre Documentation
Current version 1.0. Release date: 2016-12-03
Befor - GUI Interface
Befor Usage Befor GUI Interface Befor Command Interface
The procedure for Beftigre test using the Befor tool is given below:
The procedure for Beftigre test using the Befor tool is given below:
1. EC2 Ubuntu instance setup
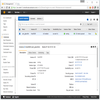
Beftigre has been tested on EC2. Notice the case-one key pair (pem) file, this is used to connect to Befor API.
Beftigre has been tested on EC2. Notice the case-one key pair (pem) file, this is used to connect to Befor API.
2. EC2 Security groups
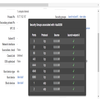
Notice that ports 22, 8080, 4848, 1, 2, and 3 presented earlier as default ports (in Befor Usage Section 3) have been added in the security group for Beftigre test.
Notice that ports 22, 8080, 4848, 1, 2, and 3 presented earlier as default ports (in Befor Usage Section 3) have been added in the security group for Beftigre test.
3. Connection and Test Parameter settings
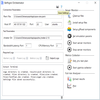
Notice case-one.pem file from EC2 setup, and ports 22, 1 and 2 already opened in security groups. Also achieved by the
Notice case-one.pem file from EC2 setup, and ports 22, 1 and 2 already opened in security groups. Also achieved by the
params API command.
4. Install setup files
This installs SIGAR API and ServerAgent, BandwidthLatencyServer and CPUMemoryAvailServer, slow and stress. Also achieved by the
This installs SIGAR API and ServerAgent, BandwidthLatencyServer and CPUMemoryAvailServer, slow and stress. Also achieved by the
setup API command.
5. Setup offload components
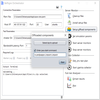
Using Linpack android app as an example, the .class files of the offloadable compute-intensice component (rs.pedjaapps.Linpack.Linpack) has been zipped into rs.zip, alongside its dependency files (in this case rs.pedjaapps.Linpack.Result). The main method to start the program is within rs.pedjaapps.Linpack.Linpack. Thus, the offload setup is as shown in the screenshot.
Note:
- When server monitor is stopped the offload components are also stopped - this is because stopping server monitoring process kills all java processes. To start the offload components again during a test, just enter only the start command without a zip.
- There could be a likely case where starting an application requires a library in the class path (used to compile), in that case, ensure that the library's jar(s) is/are uploaded in the zip alongside the classes, then run the application as follows:
-cp .:path/to/lib.jar mainclassi.e. including class path in the start command.
offload API command.
6. Set simulation params
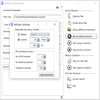
The screenshot shows simulation parameters of 20mbps bandwidth, 200ms latency, 2 CPU and memory loads with 130s timeout. The parameters are saved in SimLog. Also achieved by the
The screenshot shows simulation parameters of 20mbps bandwidth, 200ms latency, 2 CPU and memory loads with 130s timeout. The parameters are saved in SimLog. Also achieved by the
simulate API command.
7. Start server monitors
This starts the three server monitors (ServerAgent, CPUMemoryAvailServer and BandwidthLatencyServer) alongside stress and throttle utilities for simulations. Also achieved by the
This starts the three server monitors (ServerAgent, CPUMemoryAvailServer and BandwidthLatencyServer) alongside stress and throttle utilities for simulations. Also achieved by the
start API command.
8. Edit .jmx test plan
This launches a text editor with the generated test plan template. Also achieved by the
This launches a text editor with the generated test plan template. Also achieved by the
editplan API command.
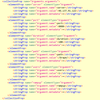
The important aspect to edit in the test plan are presented in the screenshot.
Notice port 8080 is being used, and already opened in the security group.
The server argument is same as the IP address used to connect Befor API.
Users and rampup value can be left as 1. Refer to this jmeter test plan manual for understanding some of the terms used in the test plan.
Another important argument is the path, which refers to any hosted html file or resource, which can be publicly accessed by jmeter for the test.
9. Start metrics collector
This begins metrics collection for the amount of time in seconds, specified by the duration argument within the test plan. Thus, metrics collection automatically stops after the time elapses - after which it is then adequate to stop the server monitor if you wished to. The collected metrics are saved in MetricsLog. Also achieved by the
In this phase, the Socket clients (BandwidthLatencyClient & CPUMemoryClient) are first used to retrieve the bandwidth, latency, %CPU and memory availability from the server, prior to the jmeter test - which then begins metrics collection based on %CPU and memory usage.
This begins metrics collection for the amount of time in seconds, specified by the duration argument within the test plan. Thus, metrics collection automatically stops after the time elapses - after which it is then adequate to stop the server monitor if you wished to. The collected metrics are saved in MetricsLog. Also achieved by the
collect API command.
In this phase, the Socket clients (BandwidthLatencyClient & CPUMemoryClient) are first used to retrieve the bandwidth, latency, %CPU and memory availability from the server, prior to the jmeter test - which then begins metrics collection based on %CPU and memory usage.
10. Stop server monitor
This stops the ServerAgent monitor, Socket monitors (i.e. BandwidthLatencyServer and CPUMemoryAvailServer), and throttle utility. The stress utility is automatically stopped after the specified timeout (as shown in Set simulation params section). Also achieved by the
This stops the ServerAgent monitor, Socket monitors (i.e. BandwidthLatencyServer and CPUMemoryAvailServer), and throttle utility. The stress utility is automatically stopped after the specified timeout (as shown in Set simulation params section). Also achieved by the
stop API command.
11. Extract results
This extracts results (dat and csv files) from logs. Also achieved by the
When the right required logs are selected and opened, the checkboxes for the 'Required Logs' panel are automatically checked, as shown in the subsequent screenshot.
When the 'Extract results' button is clicked, the data files (CPULog.dat, MarkerLog.dat, MemLog.dat and PowerLog.dat) and results summary file (summary.csv) are extracted into results directory.
Note that SimLog is not required for computing results, it only used to know which simulation parameters achieved a result, for repeatability of test.
This extracts results (dat and csv files) from logs. Also achieved by the
extract API command.
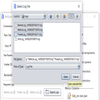
First MarkerLog, MetricsLog and PowerLog have to be selected (using the 'Select Logs' button), as shown in the screenshot.
When the right required logs are selected and opened, the checkboxes for the 'Required Logs' panel are automatically checked, as shown in the subsequent screenshot.
When the 'Extract results' button is clicked, the data files (CPULog.dat, MarkerLog.dat, MemLog.dat and PowerLog.dat) and results summary file (summary.csv) are extracted into results directory.
Note that SimLog is not required for computing results, it only used to know which simulation parameters achieved a result, for repeatability of test.
12. Plot
This plots graph from extracted (data) files. Also achieved by the
Then, click OK to plot.
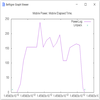
The sample graph above shows the plotting for distinct used power (i.e. power at different timestamp, from PowerLog.dat file) and the elapsed time (i.e. start and finish timestamp, from MarkerLog.dat) of the test.
This plots graph from extracted (data) files. Also achieved by the
plot API command. Clicking 'Plot' prompts to select the data files to plot.
Then, click OK to plot.
The sample graph above shows the plotting for distinct used power (i.e. power at different timestamp, from PowerLog.dat file) and the elapsed time (i.e. start and finish timestamp, from MarkerLog.dat) of the test.
